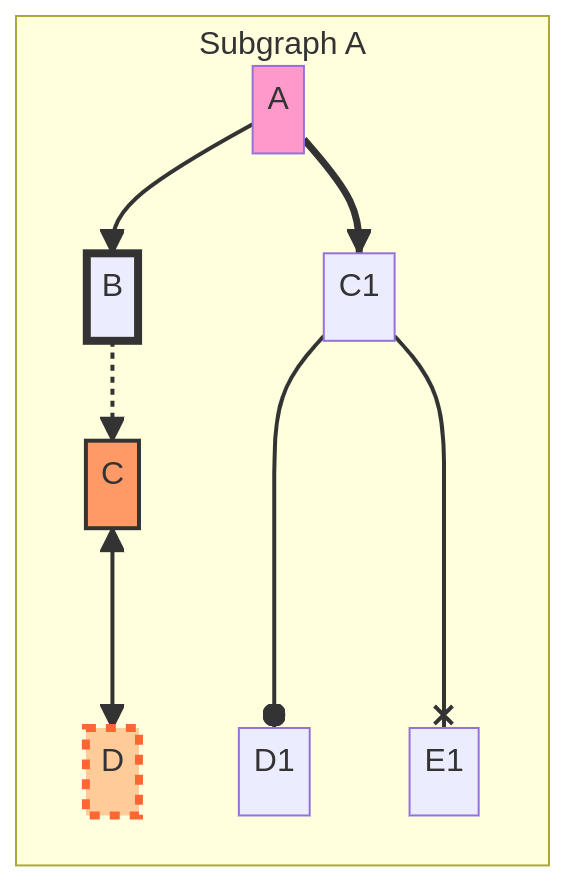
graph TD subgraph Subgraph A A --> B -.-> C <---> D A ==> C1 C1 ----o D1 C1 ----x E1 end style A fill:#f9c; style B stroke:#333,stroke-width:4px; style C fill:#f96,stroke:#333,stroke-width:2px; style D fill:#fc9,stroke:#f63,stroke-width:4px,stroke-dasharray: 5 5;
1 2 3 4 5 6 7
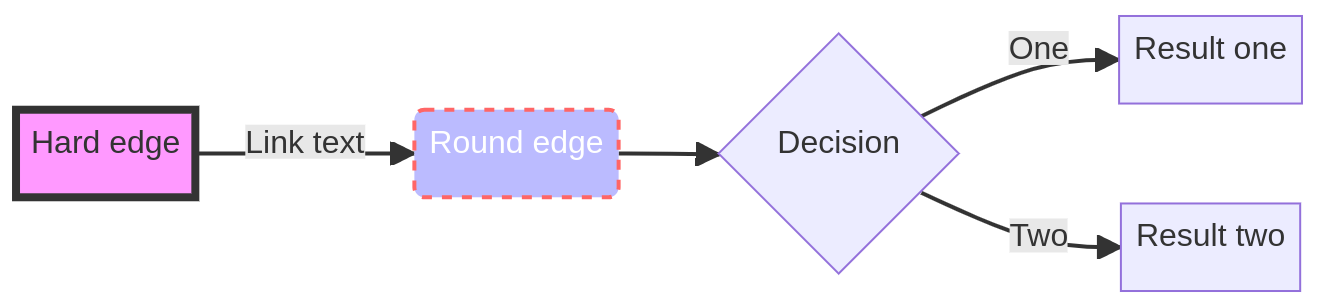
flowchart LR A[Hard edge] -->|Link text| B(Round edge) B --> C{Decision} C -->|One| D[Result one] C -->|Two| E[Result two] style A fill:#f9f,stroke:#333,stroke-width:4px style B fill:#bbf,stroke:#f66,stroke-width:2px,color:#fff,stroke-dasharray: 5
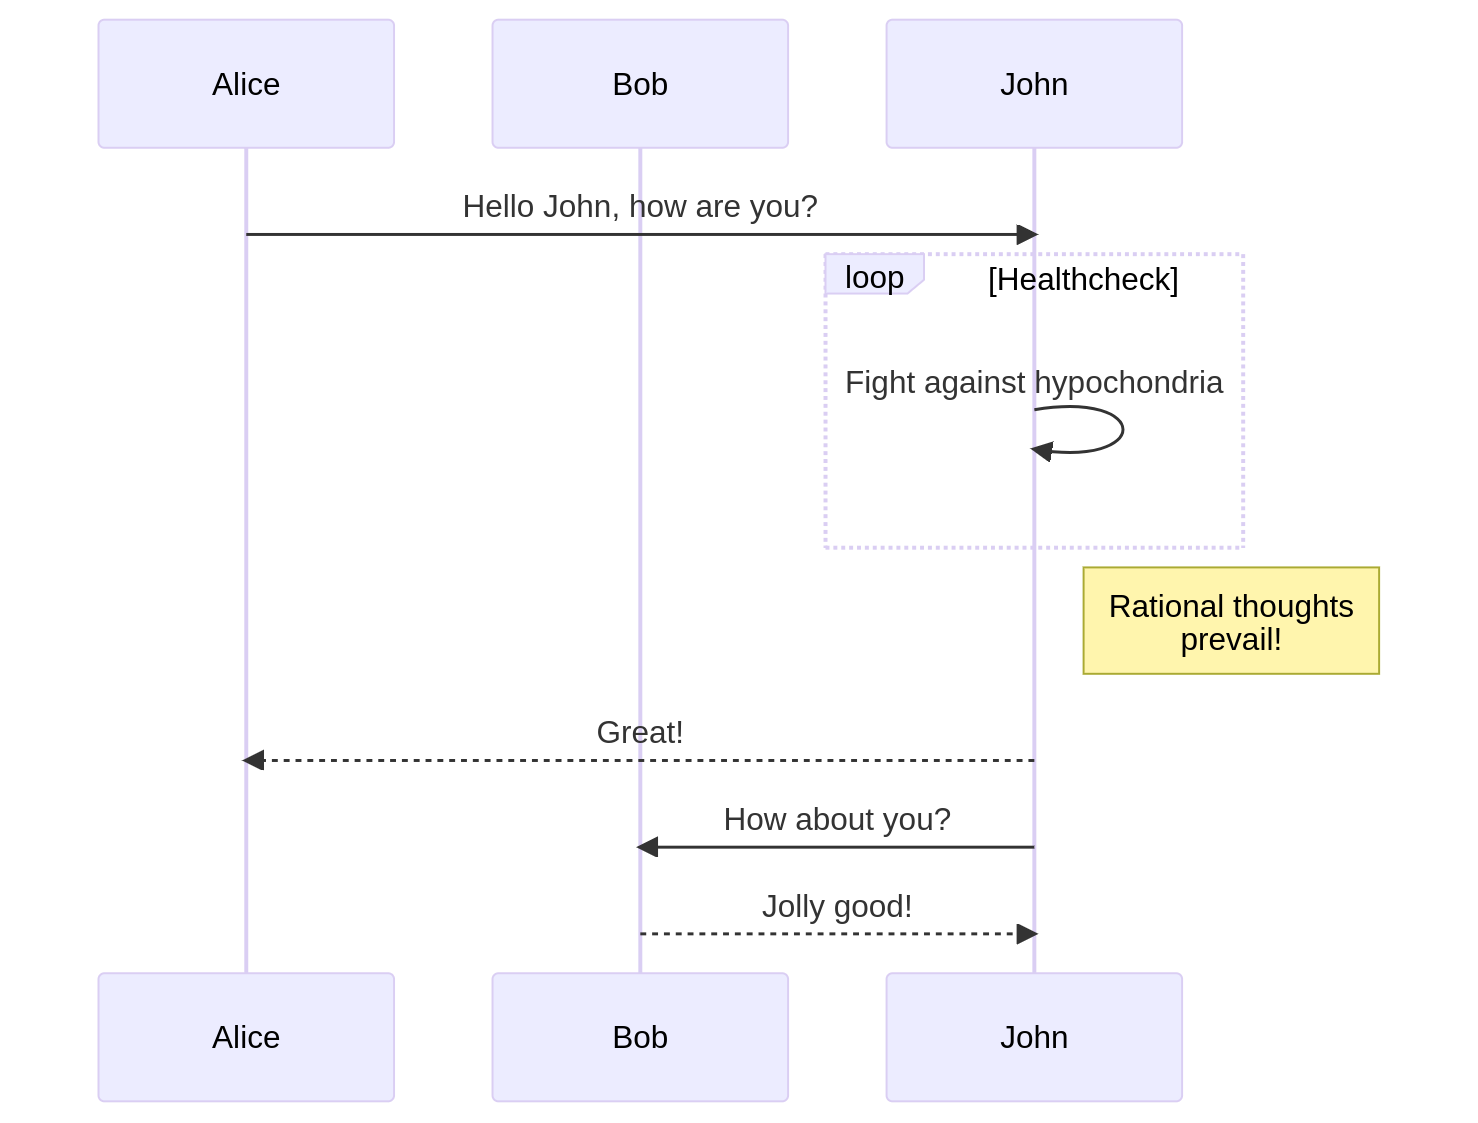
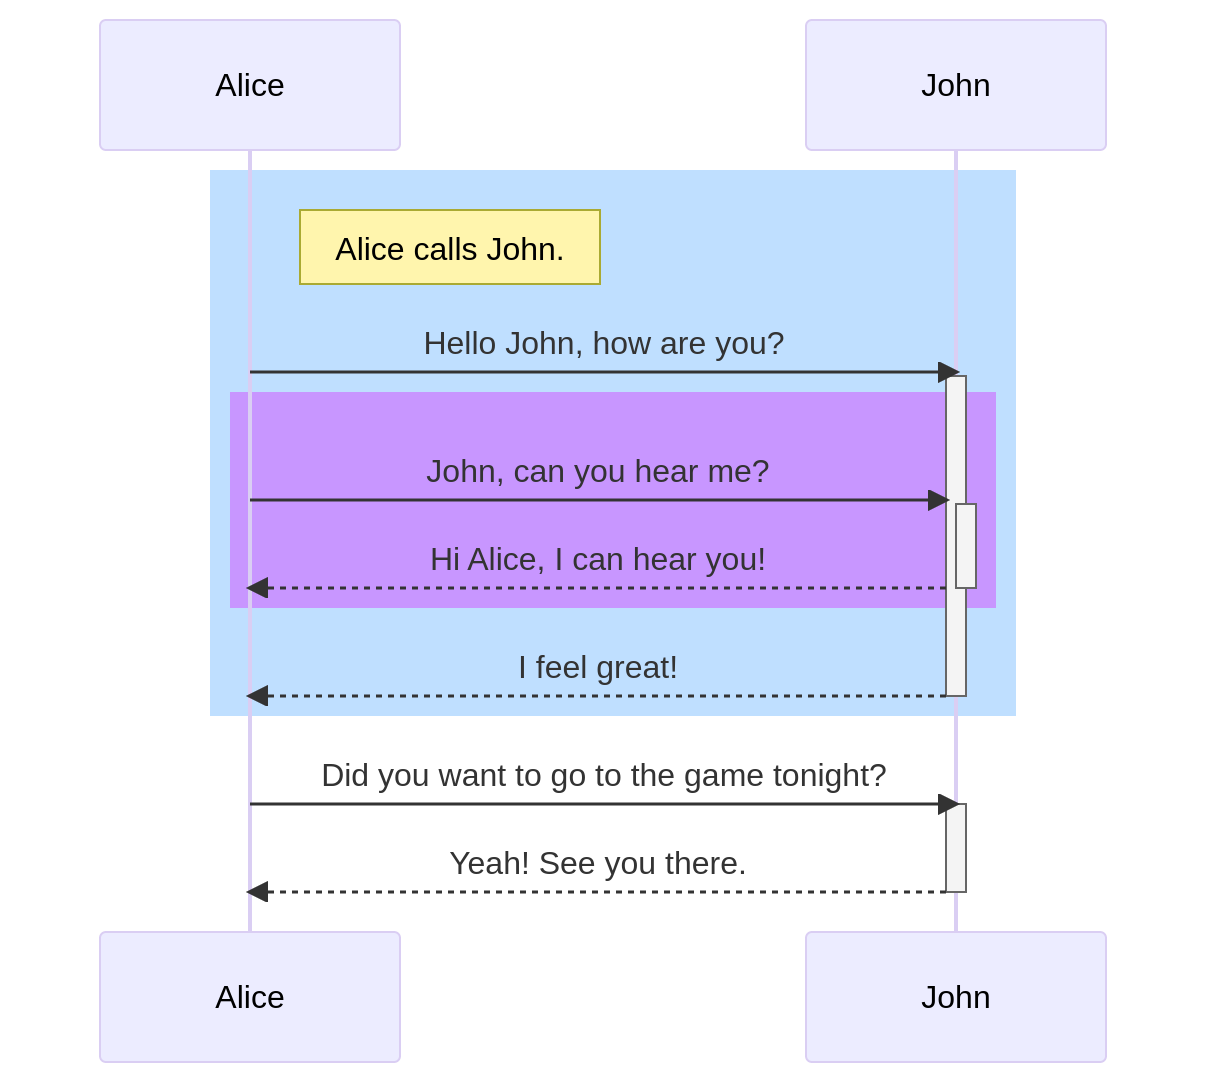
3.2 Sequence Diagram
1
2
3
4
5
6
7
8
9
10
11
sequenceDiagram participant Alice participant Bob Alice->>John: Hello John, how are you? loop Healthcheck John->>John: Fight against hypochondria end Note right of John: Rational thoughts <br/>prevail! John-->>Alice: Great! John->>Bob: How about you? Bob-->>John: Jolly good!
1 2 3 4 5 6 7 8 9 10 11 12 13 14 15
sequenceDiagram participant Alice participant John
rect rgb(191, 223, 255) note right of Alice: Alice calls John. Alice->>+John: Hello John, how are you? rect rgb(200, 150, 255) Alice->>+John: John, can you hear me? John-->>-Alice: Hi Alice, I can hear you! end John-->>-Alice: I feel great! end Alice ->>+ John: Did you want to go to the game tonight? John -->>- Alice: Yeah! See you there.
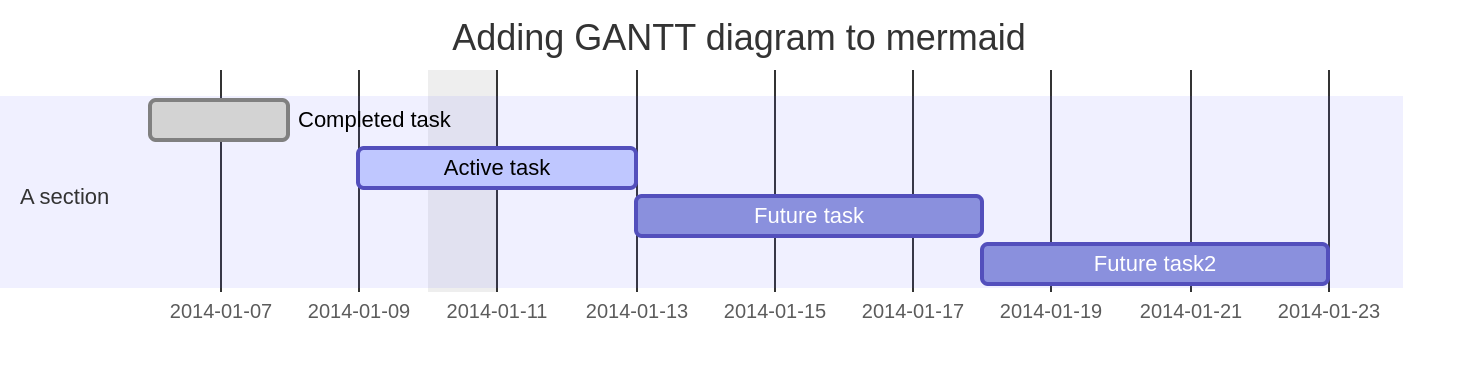
3.3 Gantt Chart
1 2 3 4 5 6 7 8 9 10
gantt dateFormat YYYY-MM-DD title Adding GANTT diagram to mermaid excludes weekdays 2014-01-10
section A section Completed task :done, des1, 2014-01-06,2014-01-08 Active task :active, des2, 2014-01-09, 3d Future task : des3, after des2, 5d Future task2 : des4, after des3, 5d
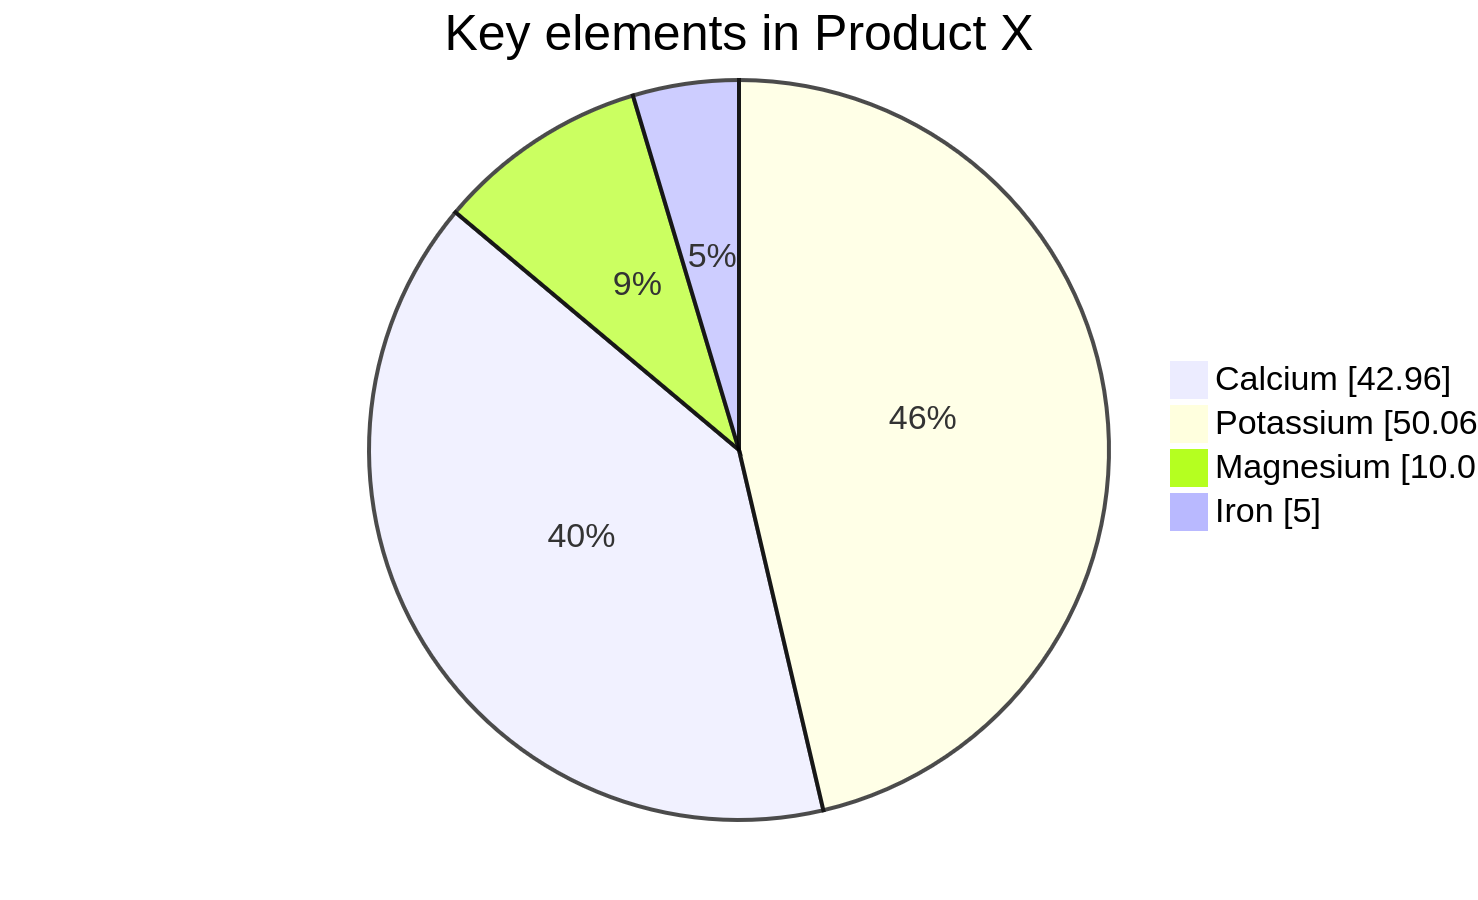
3.4 Pie Chart
1 2 3 4 5 6
pie showData title Key elements in Product X "Calcium" : 42.96 "Potassium" : 50.06 "Magnesium" : 10.01 "Iron" : 5
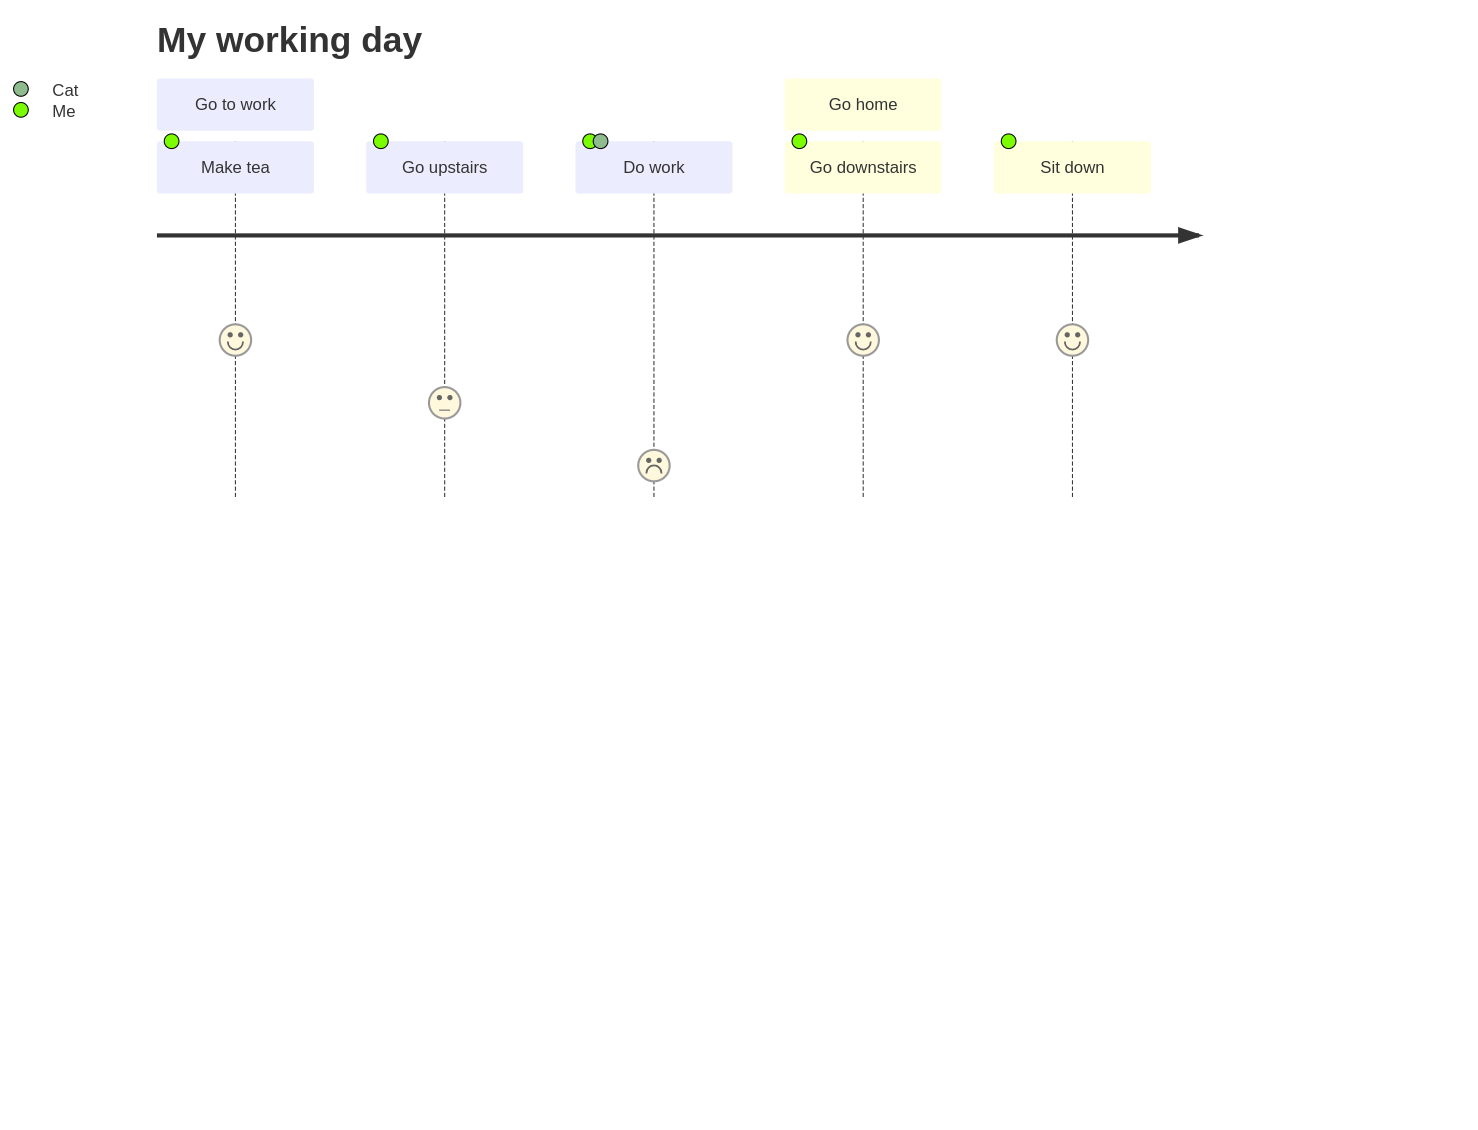
journey title My working day section Go to work Make tea: 5: Me Go upstairs: 3: Me Do work: 1: Me, Cat section Go home Go downstairs: 5: Me Sit down: 5: Me
3.7 Requirement Diagram
1 2 3 4 5 6 7 8 9 10 11 12 13 14
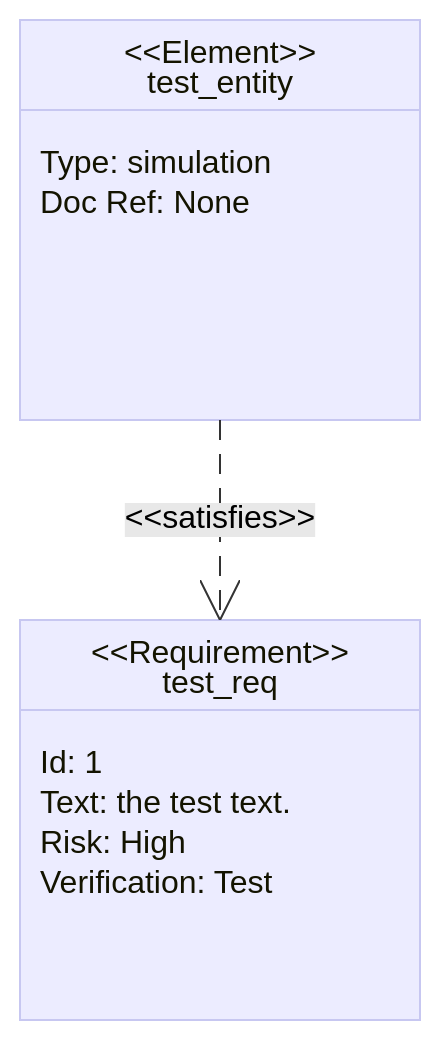
requirementDiagram
requirement test_req { id: 1 text: the test text. risk: high verifymethod: test }